Modeling Future NFL Draft Picks
Using Vegas win total lines and prediction intervals to battle uncertainty.
It’s NFL draft season — and with it, has come some healthy discourse on the value of future draft picks in trade discussions.
The Arizona Cardinals currently hold pick 4, knowing the Minnesota Vikings appear eager to trade up and select a quarterback. Let’s imagine the Vikings offer pick 11, a 2024 second-round pick and their 2025 first-round pick for pick 4.
But there’s a caveat: the Cardinals can select whether they’d prefer the Vikings future 2025 first-round pick, or the 23rd overall pick in the 2024 draft.
Trade charts (such as the Jimmy Johnson chart, Fitzgerald-Spielberger chart) help to value current-year draft picks in numerical terms for easy comparison. For example, the Fitzgerald-Spielberger chart values the Cardinals 4th overall pick at 2270 points and the Vikings 23rd overall pick at 1349, meaning Arizona holds a 1.68x more valuable selection.
But how should the Cardinals go about valuing the Vikings 2025 first-round pick? The pick could be as high as 1 (3000 points) or as low as 32 (1175 points). Intuition suggests the Vikings are more likely to hover around 16 but how much more likely? How can we measure this spread of probabilities?
Using Vegas to Model this Uncertainty.
One way is to model out the Vikings record for the next season. While battling a fair amount of uncertainty, we can still feel more confident in understanding where this pick may fall.
A proxy for this, however, is over-under win totals in betting markets. Some sportsbooks (albeit, not the sharper ones) are setting lines for next season’s win counts.
We can compare all 32 teams and piece together an implied 2025 draft order based on these win totals. The Patriots and Panthers, for example, are listed at 4.5 wins, the lowest of all teams. Vegas is implicitly signaling that the number one overall pick will most likely fall in the hands of one of these two teams. The teams listed at a league-high 11.5 wins (Ravens, 49ers, and Chiefs), however, are expected to receive the 30th, 31st, and 32nd overall picks.
Going back to 2010, I plotted each team’s projected draft position using this win total line against their actual draft pick (before any trades).1 For ties in projected win totals, I used a random number generator to distribute the picks.
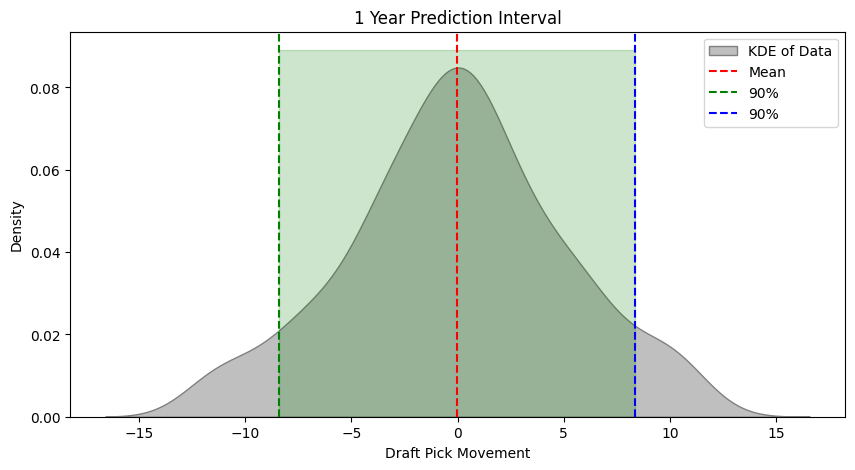
With an r-value of 0.77, we can see a decently strong correlation.Equipped with this data, we move to prediction intervals2. Given the following histogram, our sample size (~450), and a linear Q-Q plot, we feel comfortable in assuming normality and unlocking parametric tests.
We opt for a kernel-density estimate (KDE) to preserve nuances in the underlying distribution, but assume normality. A z-test with a 90% prediction interval is illustrated below, effectively stating: we are 90% confident that a draft pick will stay within 8 selections from its preseason prediction.

Let’s apply this back to the Vikings/Cardinals hypothetical trade. Currently tied with four other teams at 6.5 wins, sportsbooks are implying a Minnesota draft selection anywhere from 5th overall to 8th overall. A random number generator gives them 7th overall.
With 90% confidence, the Cardinals can now assume that the Vikings 2025 first-round pick will be no worse than 15th overall (7th overall + 8 pick spread).
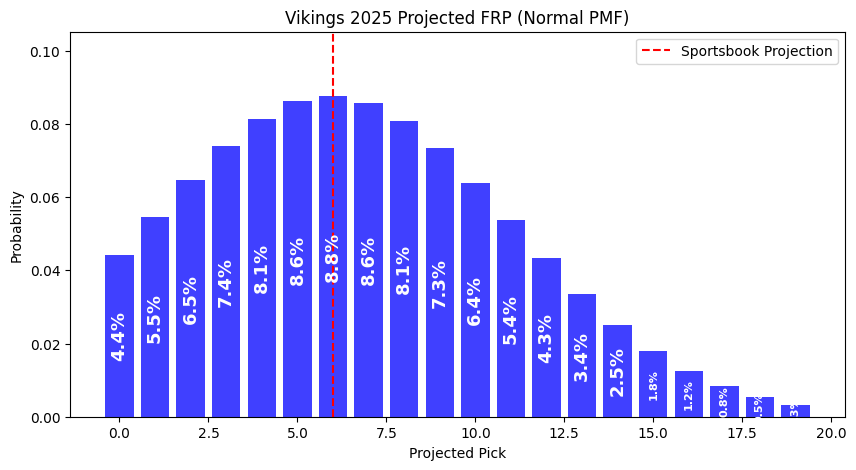
Using probability mass function (PMF), we can also roughly assign probabilities for where the Vikings 2025 FRP will land. Notably, the distribution assigns a 50% chance the draft selection falls between Pick 4 and Pick 9.3

The Ultimate Purpose? To Improve Decision-Making.
The decision still looms: should the Cardinals opt for the 23rd overall pick in the ‘24 NFL Draft, adding an instant playmaker for the upcoming season? Or should they be patient and hope to land on the left side of this distribution in ‘25 Draft?
As discussed in Massey & Thaler (2013), Joseph Hefner of KC Sports Network, and many others, GMs have historically undervalued future draft selections. This is largely driven by the uncertainty of how a team will perform and thus, where their draft selection will land.
Preseason betting markets, however, can be used to model this uncertainty to a reasonable extent. Prediction intervals and probability density functions also offer more intuitive ways to comprehend draft ranges. The range of all possible first-round draft positions is 1-32, but the range of all probable first-round draft positions is notably different.
Understanding that with 90% confidence, the Cardinals can set the floor of the Vikings ‘25 FRP at Pick 15 helps foster educated decision-making. As does understanding there’s a 50% chance the pick falls between four and nine.
Some Considerations & Improvements.
(See below!) There’s an aspect of Bayesian updating here. Given the Vikings draft JJ McCarthy or Drake Maye, for example, how does that change the range of probabilities?
I’d be curious to see how this investigation fares with Super Bowl favorites versus win totals. Pinnacle, a notoriously sharp book, released their 2025 Super Bowl lines here. I view Pinnacle’s lines as more efficient than DraftKings/FanDuel but struggled to find free sources of historical Pinnacle data.
It’s been well discussed (Joseph Hefner had a great piece), but the concept that teams apply a 55% discount rate to future draft capital is absurd. Patience & long-term thinking (largely enabled by stale ownership) is a deep competitive advantage. Good post on this by Gaurav Verma here.
A (Bayesian) Update
4/26 - A day after the ‘24 NFL Draft:
While the Vikings did not trade with the Cardinals, Minnesota did select quarterback JJ McCarthy at Pick 10. I wanted to investigate if this new evidence somehow altered the Vikings’ original projection.
To perform a Bayesian analysis on this Vikings curve, I gathered all 1st round QB selections going back to 2010 and their team’s draft positions the following year. Think: the Cardinals’ 10th overall selection of Josh Rosen in 2018 leading to the 1st overall selection in 2019 (Kyler Murray).
The green curve pictured below emerges. While non-normal, we can update the original Vikings ‘25 FRP draft curve (in blue) to account for this new evidence. The red curve is the posterior or final distribution for the Vikings selection given they draft a quarterback.
Interestingly, picks 7-11 became substantially more likely while accounting for the new evidence. This intuitively makes sense — the Vikings are likely to enjoy more success with a new quarterback in 2024.
Happy to further the discussion @SBajajSports on Twitter or sb7983@nyu.edu.
Sports Odds History was a free & easy way to wrangle this data but with a big caveat: there’s no mention for when the odds are taken in the preseason process. If win totals were collected a day before the season, for example, they would price in injuries, 53-man rosters, etc. and generally be more accurate than the pre-draft process.
The distinction between confidence and prediction intervals is important here. Confidence intervals quantify uncertainty around a parameter (i.e. mean, median) in a population while prediction intervals deal with uncertainty around a single datapoint. In this investigation, we’re looking at the Vikings singular draft selection interval, so we use prediction intervals. Naturally, prediction intervals have more variability.
If this doesn’t feel right, you’re not alone. A crucial (and potentially flawed) part of this process is the DraftKings win total lines. DraftKings has the Vikings as the 5th-8th worst team by record, while sharper books like Pinnacle have Minnesota as the 12th worst overall Super Bowl odds. There's disagreement, but sharper books have not released win totals, leaving us to deal with DraftKings. See point #2 in the “Considerations & Improvements” section above.


You are the GOAT